
Understanding key online fashion statistics will help you analyse your fashion marketing performance while also being able to benchmark the success of your campaigns. For example, understanding peak times and dominant months allows for much more effective and targeted campaigns towards higher intent buying.
FASHION ECOMMERCE STATISTICS IN 2021/22 – A MARKET OVERVIEW
When it comes to Fashion Ecommerce there are clear signs – according to the data from our 2022 Fashion Ecommerce Stats & Trends Report – that the demand for clothing, accessories and other fashion items is on the rise. In fact, despite the current economic situation – including the cost of living crisis and an economic crisis – it has been widely reported that although the global online fashion market was worth a huge $533 billion in 2018, it is predicted to grow to a staggering $872 billion by next year (Statista).
Fashion purchasing has changed vastly during these times. Almost two decades on from the release of the first iPhone, mobile shopping is a standard part of fashion ecommerce models. We have seen the effects of fashion ecommerce taking place with high street closures of clothing stores including TopShop, Debenhams, Oasis and Warehouse – being taken over by better-performing fashion retail sites and apps e.g. ASOS.
When looking at the data, it can be argued that advances in mobile technology along with a new generation of tech-savvy consumers have been playing a massive role in the world of ecommerce – particularly in fashion. This means that the world of ecommerce has more opportunities than ever before to make a significant impact on their customer base.
As well as recognising positive advances in the ongoing ecommerce climate, this report highlights both the challenges and the opportunities within the fashion sector for your current and upcoming ecommerce fashion campaigns.
ECOMMERCE FASHION INDUSTRY STATS BY DEVICE – MOBILE VS. DESKTOP
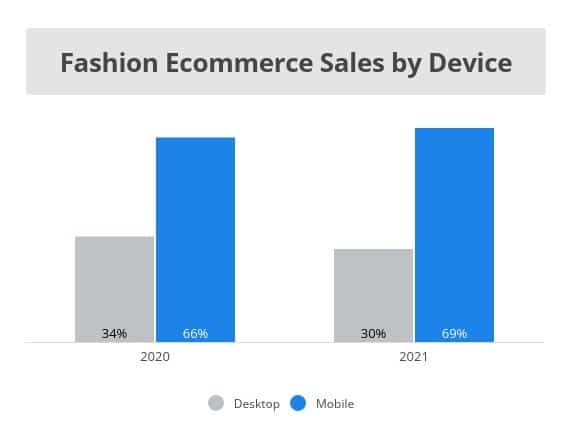
Mobile traffic in the fashion sector is on the rise, accumulating over half of all internet traffic.
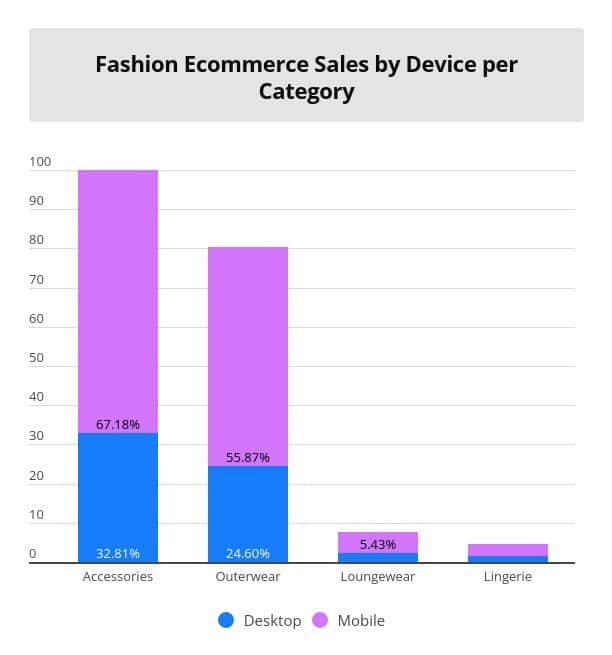
Looking further into these traffic numbers, you can see that all fashion categories – accessories, outerwear, loungewear and lingerie – are bought primarily via mobile devices across the board by significant amounts, making up over 69% of sales compared to desktop, with just 30% of all online sales.
Retail faces a whole new generation of online consumers who use smartphones as their main mode of shopping. Ecommerce payment methods (or online cashless payments), along with simple one-touch functions such as adding to your ‘wish list’ or using ‘save for later’ buttons, means that online fashion brands are getting better and better at replicating a real-life browsing experience without the hassle of leaving the home.
This, combined with the typically younger demographic of the fashion industry, means that fashion consumers are much more reliant on digital devices now than ever, and as mobile technology becomes more advanced and accessible in 2022, we see that mobile sales produce greater numbers compared to desktop.
Encouraging your consumers to browse and buy via desktop can be challenging in the fashion sector. When we begin to break down and analyse standard customer behaviours according to stats, it’s clear that people are more likely to purchase via desktop when the item has a higher average order value (AOV) and are more complex – in this case, clothing can be seen as more of a nonessential grade of ecommerce (compared to say, the online travel industry or homeware goods sectors where mobile vs desktop conversion rates are more in favour of desktop).
Recognising that fashion buyers prefer mobile shopping is key, however, there are certain ways to allow your customers to browse and buy via both platforms (mobile and desktop). Optimising each platform with similar functions and layouts to coordinate for a complete brand presence can help encourage more sales across the board, for a smooth and more usable customer experience.
CONSUMER VS. LUXURY FASHION MARKET BUYING HABITS
No matter what the item or the cost, price is an important defining feature when it comes to consumer vs. luxury fashion items. With ‘basic’ or consumer goods, lower prices and discount codes are typically emphasised, whilst higher priced products are justified with added features and/or novelties – for example, the brand of clothing or the exclusivity of an item. In other words, average order values (or AOVs) are higher or lower depending on the sector.
With these polar differences in price in the fashion sector, certain consumer behaviours come into play when shopping online. Understanding these buying attitudes and customer spending habits is essential to the success of any conversion effort.
As already mentioned, we recognise that sales with higher AOVs tend to be carried out via desktop due to a better viewing experience. However, in the fashion sector, a new generation of consumers is more likely to complete a sale through their mobile devices.
Delving deeper into each fashion sector by device, it has been found that the percentage of online sales is higher on desktops for luxury marketing. We can gather that consumers buying luxury fashion items with a higher AOV are more comfortable carrying this out via desktop, like much of ecommerce dictates.
EFFECTS OF SEASONALITY IN THE FASHION INDUSTRY
November is recognised by ecommerce as the yearly peak for online shopping and sales thanks to events such as Black Friday and the run-up to Christmas, and we have found that this follows suit in this year’s report.
However in the fashion industry, we expect to see peaks in sales around months (or seasons) that are appropriate for each item of clothing, and following seasonal releases from brand designers.
We can see that seasonality comes into play when we look at an example of a clothing item from the report – shorts. Shorts prove popular throughout most of the year, but especially in the summer months, peaking in June with 591,380 purchased. But in December, shorts sales decreased by over 83%.
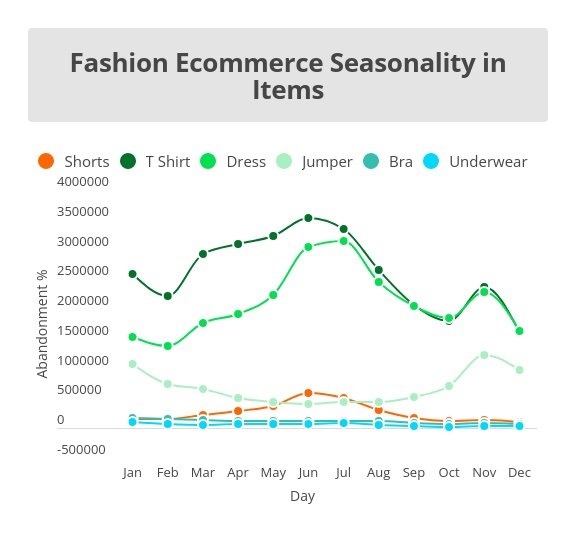
According to the fashion ecommerce calendar, there was a significant spike in sales in July, after a steady increase during the summer months. Consumers are more likely to buy new clothes during this period to refresh their wardrobes for the summer months, or holiday season, especially now that we are living in a post-covid climate and activities such as socialising and travelling are back on track to being standard practice.
As you can see, fashion items including T-shirts, dresses, jumpers, trousers, bras and underwear are the most popular items and stay at similar sales volume throughout the year. We can consider these garments as non-seasonal, as they hold the ability to be worn throughout the year thanks to different styles and trends provided by fashion brands.
It’s important to consider seasonality when determining stock levels essential to get your inventory stock management perfect, and when to utilise sales in order to get rid of unwanted stock build-up.
ONLINE TRAFFIC TRENDS IN CLOTHES SHOPPING
To aim in the correct direction to capture as many sales as possible, ecommerce brands should first direct their focus on better understanding the behaviours and actions of their customers. By investigating online traffic against all of the other factors within a certain period, including abandonment levels, we can gauge the intent levels of users throughout the year. This can be utilised to get you the best conversions going forward.
There’s a major drive in online traffic in the fashion sector at the beginning of the year, starting with January at the highest rates. This comes during and directly after typical online sales are occurring. Sales are also relevant here with the second-highest peak occurring in November. November generally boasts the highest amount of traffic within the fashion industry thanks to Black Friday and Cyber Monday, Singles Day and Christmas the following month. Although typically popular, it’s still important that brands continue to push sales around this period to compete with others in the market and to secure a wider audience.
According to this year’s findings, Thursday is the most popular day of the week to purchase a fashion item. We can gather that when it comes to clothing and outfits, customers want to purchase their items with enough time to spare (for delivery, for example) in time for social events – which typically occur at the weekend. This is supported by the fact that Saturday was found to be the least popular day to purchase in the fashion sector, aiding the theory that most consumers are preoccupied.
We have also found that when it comes to the time of day, there is a slow gradual growth in sales throughout daylight hours, leading to the highest sales time at 8 pm. This peak in sales drops off after 9pm, until the cycle of growth in sales starts again at around 2 am.
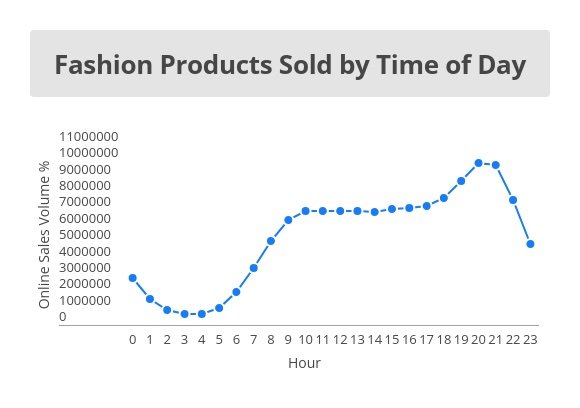
Looking further into behavioural patterns against the data, we can assume that sales happen later in the day due to out-of-work hours and/ or ‘downtime’. We can also predict that sales are happening in the early hours of the morning thanks to mobile commerce technology, giving consumers the chance to browse and purchase with ease.
Using these predicted downtime hours and other shopping behaviours could help to coordinate marketing strategies for better ecommerce customer retention in your brand’s base, leading to a significant improvement in sales.
FASHION INDUSTRY EMAIL TRENDS AND ESSENTIAL HYPER_PERSONALISATION
Email marketing in the fashion industry has gotten much more advanced over time to increase online engagement and this is largely due to hyper-personalisation. Hyper-personalisation delivers perfectly selected individual SKUs (right size, brand, colour etc) essentially driving that individual consumer to your site and checkout – including images of the desired item. This technology will advance over time, so it is vital to harness these tactics as part of your standard fashion ecommerce strategy whether you’re in the consumer or luxury sector. Hyper-personalisation solutions have distinct differences, they are designed to deliver the highest ROI in fashion marketing according to both McKinsey and Statista.
According to this year’s report, luxury fashion has a much higher email open rate and click rate. We can gather that this is because luxury brands tend to focus on much more personalised marketing tactics to secure that large scale. When consumers see their name (for example) connected to an exclusive or expensive item, they are more likely to investigate and open the email.
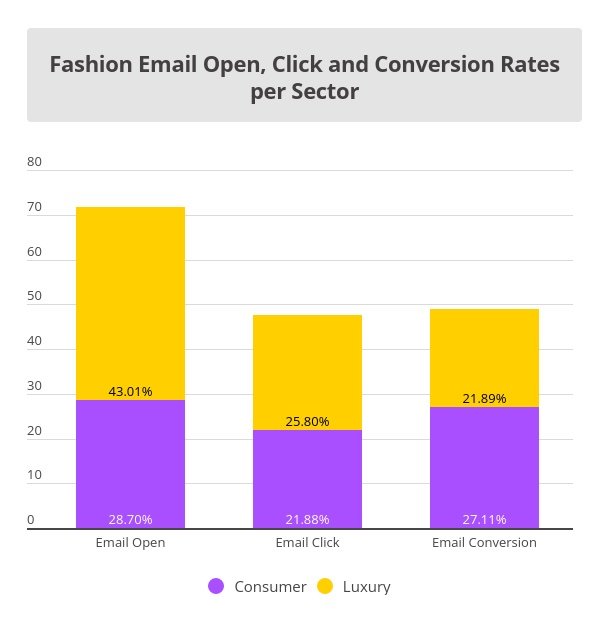
However, when it comes to consumer fashion, we can see that customers are more likely to convert, meaning they are more likely to commit to completing their customer journey by carrying out a sale.
We are aware that this sector in fashion tends to offer more discounts and sale opportunities to attempt to gain more sales for a higher AOV. Customers are highly likely to take advantage of these sales opportunities, especially when a “limited offer” or “flash-sale” narrative is used to create a sense of urgency.
FASHION ECOMMERCE STATISTICS: KEY TAKEAWAYS
In 2022, it has been made clear that mobile technology in fashion ecommerce reigns supreme across all sectors and regions, telling us that we’re quite literally taking our ecommerce journey into our own hands with more efficiency.
Hyper-personalisation emails are essential to fashion ecommerce technology, making sales periods much more popularised, almost eliminating RoR, and delivering the highest customer lifetime value. Leading on from this, we have learned that the fashion sector follows standard ecommerce sales trends as we see peaks in numbers around the summer months and during popular winter sales periods (November-December), thanks to public holidays. This is also thanks to seasonality trends in fashion, encouraging consumers to revive their wardrobes at certain times of the year.
One Response
As a marketing student I found your post very interesting and promising !