In the world of predictive analytics, knowing how they work should not be just the domain of University students, mathematicians and analytics geeks. Ecommerce retailers and professional marketers alike if not already will come to rely on the product they deliver. Having a general understanding is therefore useful for future application. This article is intended to satiate that appetite.
Predictive analytics tools are powered by several different models and algorithms that can be applied to a wide range of use cases. Determining what predictive modelling techniques are best for your company is key to getting the most out of a predictive analytics solution and leveraging data to make insightful decisions.
For example, consider a retailer looking to reduce customer churn. They might not be served by the same predictive analytics models used by a hospital predicting the volume of patients admitted to the emergency room in the next ten days.
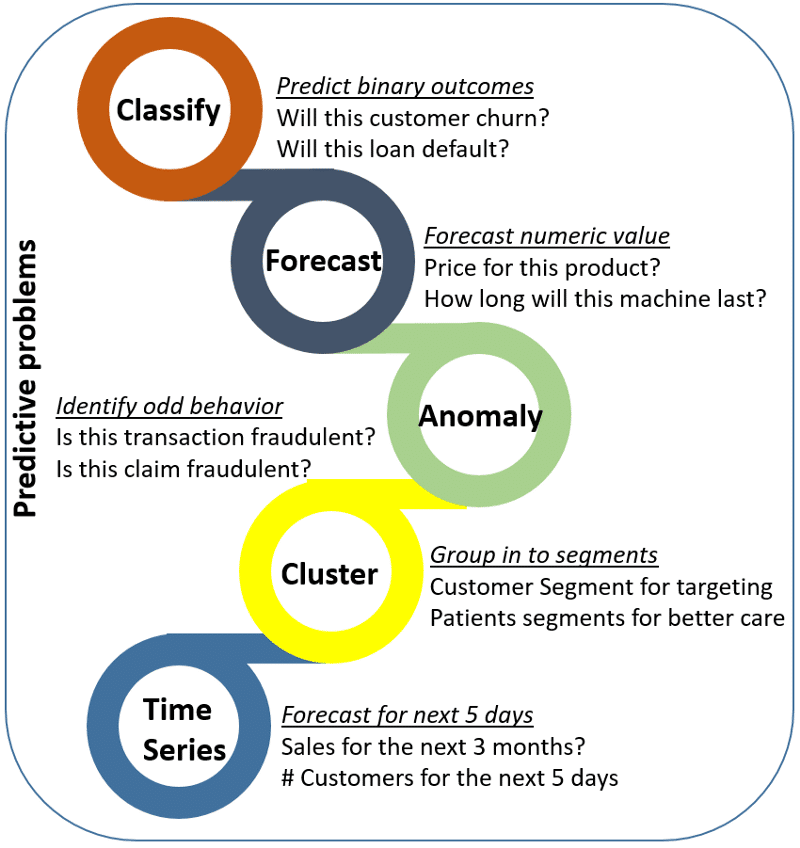
The most often used predictive analytics models
Classification Model
The classification model is, in some ways, the simplest of the several types of predictive analytics models we’re going to cover. It puts data in categories based on what it learns from historical data.
Classification models are best to answer yes or no questions, providing broad analysis that helps guide decisive action. These models can answer questions such as:
- For a retailer, “Is this customer about to churn?”
- For a loan provider, “Will this loan be approved?” or “Is this applicant likely to default?”
- For an online banking provider, “Is this a fraudulent transaction?”
The breadth of possibilities with the classification model—and the ease by which it can be retrained with new data—means it can be applied to many different industries.
Clustering Model
The clustering model sorts data into separate, nested smart groups based on similar attributes. If an ecommerce shoe company is looking to implement targeted marketing campaigns for their customers, they could go through the hundreds of thousands of records to create a tailored strategy for each individual.
But is this the most efficient use of time? Probably not. Using the clustering model, they can quickly separate customers into similar groups based on common characteristics and devise strategies for each group at a larger scale.
Other use cases of this predictive modelling technique might include grouping loan applicants into “smart buckets” based on loan attributes, identifying areas in a city with a high volume of crime, and benchmarking SaaS customer data into groups to identify global patterns of use.
Forecast Model
One of the most widely used predictive analytics models, the forecast model deals in metric value prediction, estimating numeric value for new data based on learnings from historical data.
This model can be applied wherever historical numerical data is available. Scenarios include:
- A SaaS company can estimate how many customers they are likely to convert within a given week.
- A call centre can predict how many support calls they will receive per hour.
- A shoe store can calculate how much inventory it should keep on hand to meet demand during a particular sales period.
The forecast model also considers multiple input parameters. If a restaurant owner wants to predict the number of customers she is likely to receive in the following week, the model will take into account factors that could impact this, such as: Is there an event close by? What is the weather forecast? Is there an illness going around?
Outliers Model
The outliers model is oriented around anomalous data entries within a dataset. It can identify anomalous figures either by themselves or in conjunction with other numbers and categories.
- Recording a spike in support calls, which could indicate a product failure that might lead to a recall
- Finding anomalous data within transactions, or in insurance claims, to identify fraud
- Finding unusual information in your NetOps logs and noticing the signs of impending unplanned downtime
The outlier model is particularly useful for predictive analytics in retail and finance. For example, when identifying fraudulent transactions, the model can assess not only the amount but also the location, time, purchase history and the nature of a purchase (i.e., a £1000 purchase on electronics is not as likely to be fraudulent as a purchase of the same amount on books or common utilities).
Time Series Model
The time series model comprises a sequence of data points captured, using time as the input parameter. It uses the last year of data to develop a numerical metric and predicts the next three to six weeks of data using that metric.
Use cases for this model include the number of daily calls received in the past three months, sales for the past 20 quarters, or the number of patients who showed up at a given hospital in the past six weeks. It is a potent means of understanding the way a singular metric is developing over time with a level of accuracy beyond simple averages. It also takes into account seasons of the year or events that could impact the metric.
If the owner of a salon wishes to predict how many people are likely to visit his business, he might turn to the crude method of averaging the total number of visitors over the past 90 days. However, growth is not always static or linear, and the time series model can better model exponential growth and better align the model to a company’s trend. It can also forecast for multiple projects or multiple regions at the same time instead of just one at a time.
Common Predictive Algorithms
Overall, predictive analytics algorithms can be separated into two groups: machine learning and deep learning.
- Machine learning involves structural data that we see in a table. Algorithms for this comprise both linear and nonlinear varieties. Linear algorithms train more quickly, while nonlinear are better optimised for the problems they are likely to face (which are often nonlinear).
- Deep learning is a subset of machine learning that is more popular to deal with audio, video, text, and images.
With machine learning predictive modelling, several different algorithms can be applied. Below are some of the most common algorithms that are being used to power the predictive analytics models described above.
Random Forest
Random Forest is perhaps the most popular classification algorithm, capable of both classification and regression. It can accurately classify large volumes of data.
The name “Random Forest” is derived from the fact that the algorithm is a combination of decision trees. Each tree depends on the values of a random vector sampled independently with the same distribution for all trees in the “forest.” Each one is grown to the largest extent possible.
Predictive analytics algorithms try to achieve the lowest error possible by either using “boosting” (a technique which adjusts the weight of an observation based on the last classification) or “bagging” (which creates subsets of data from training samples, chosen randomly with replacement).
Random Forest uses bagging. If you have a lot of sample data, instead of training with all of them, you can take a subset and train on that, and take another subset and train on that (overlap is allowed). All of this can be done in parallel. Multiple samples are taken from your data to create an average.
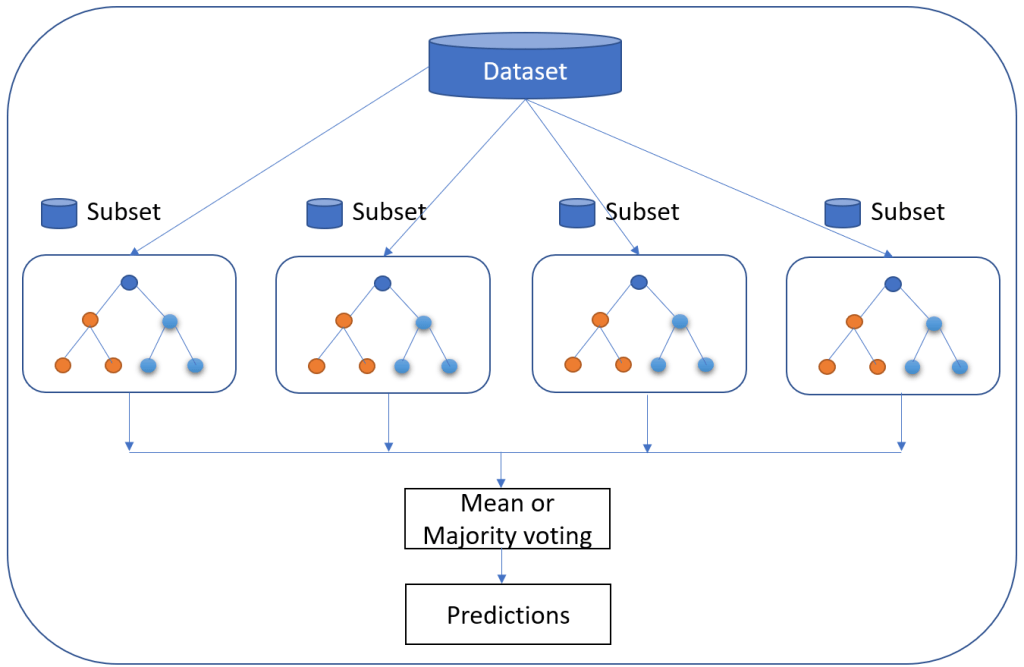
While individual trees might be “weak learners,” the principle of Random Forest is that together they can comprise a single “strong learner.”
The popularity of the Random Forest model is explained by its various advantages:
- Accurate and efficient when running on large databases
- Multiple trees reduce the variance and bias of a smaller set or single tree
- Resistant to overfitting
- Can handle thousands of input variables without variable deletion
- Can estimate what variables are important in classification
- Provides effective methods for estimating missing data
- Maintains accuracy when a large proportion of the data is missing
Generalised Linear Model (GLM) for Two Values
The Generalised Linear Model (GLM) is a more complex variant of the General Linear Model. It takes the latter model’s comparison of the effects of multiple variables on continuous variables before drawing from an array of different distributions to find the “best fit” model.
Let’s say you are interested in learning customer purchase behaviour for winter coats. A regular linear regression might reveal that for every negative degree difference in temperature, an additional 300 winter coats are purchased. While it seems logical that another 2,100 coats might be sold if the temperature goes from 9 degrees to 3, it seems less logical that if it goes down to -20, we’ll see the number increase to the same degree.
The Generalised Linear Model would narrow down the list of variables, likely suggesting that there is an increase in sales beyond a certain temperature and a decrease or flattening in sales once another temperature is reached.
The advantage of this algorithm is that it trains very quickly. The response variable can have any form of exponential distribution type. The Generalised Linear Model is also able to deal with categorical predictors while being relatively straightforward to interpret. On top of this, it provides a clear understanding of how each of the predictors is influencing the outcome and is fairly resistant to overfitting. However, it requires relatively large data sets and is susceptible to outliers
Gradient Boosted Model (GBM)
The Gradient Boosted Model produces a prediction model composed of an ensemble of decision trees (each one of them a “weak learner,” as was the case with Random Forest), before generalising. As its name suggests, it uses the “boosted” machine learning technique, as opposed to the bagging used by Random Forest. It is used for the classification model.
The distinguishing characteristic of the GBM is that it builds its trees one tree at a time. Each new tree helps to correct errors made by the previously trained tree—unlike in the Random Forest model, in which the trees bear no relation. It is very often used in machine-learned ranking, as in the search engines Yahoo and Yandex.
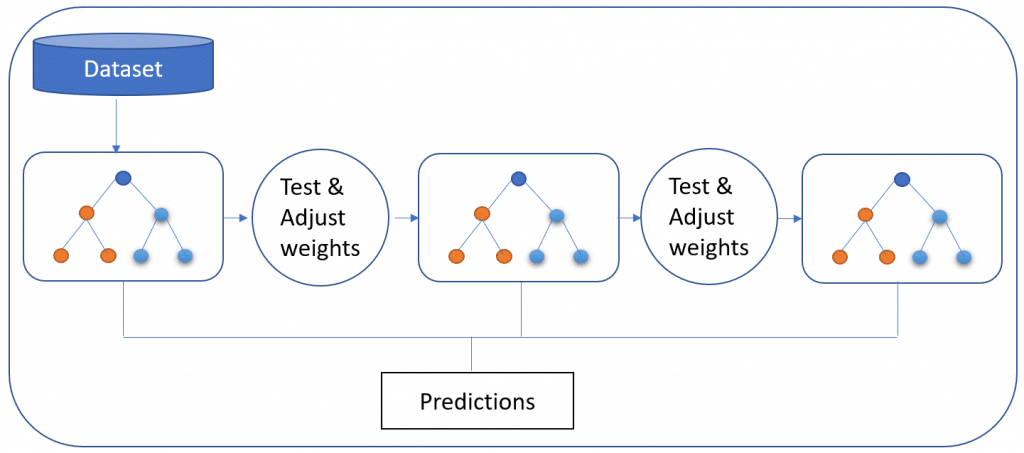
Via the GBM approach, data is more expressive, and benchmark results show that the GBM method is preferable in terms of the overall thoroughness of the data. However, as it builds each tree sequentially, it also takes longer. That said, its slower performance is considered to lead to better generalisation.
K-Means
A highly popular, high-speed algorithm, K-means involves placing unlabeled data points in separate groups based on similarities. This algorithm is used for the clustering model. For example, Tom and Rebecca are in group one and John and Henry are in group two. Tom and Rebecca have very similar characteristics but Rebecca and John have very different characteristics. K-means tries to figure out what the common characteristics are for individuals and groups them. This is particularly helpful when you have a large data set and are looking to implement a personalised plan—this is very difficult to do with one million people.
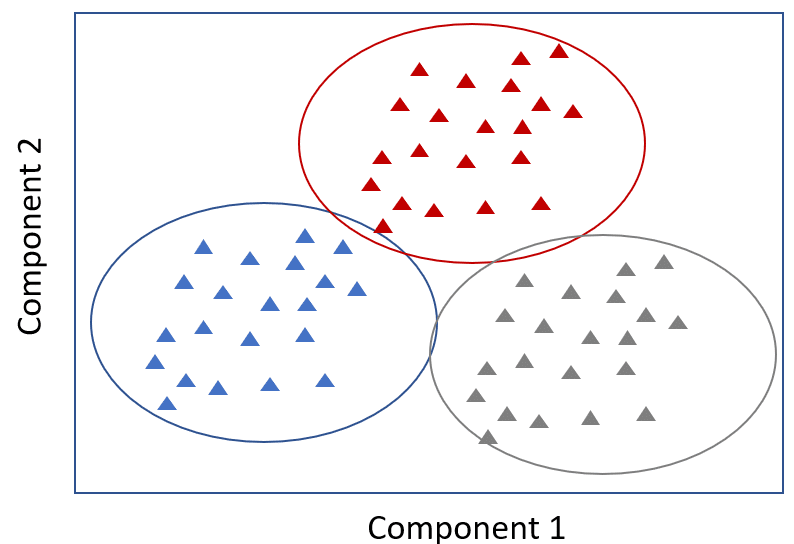
In the context of predictive analytics for healthcare, a sample size of patients might be placed into five separate clusters by the algorithm. One particular group shares multiple characteristics: they don’t exercise, they have an increasing hospital attendance record (three times one year and then ten times the next year), and they are all at risk for diabetes. Based on the similarities, we can proactively recommend a diet and exercise plan for this group.
Prophet
The Prophet algorithm is used in the time series and forecast models. It is an open-source algorithm developed by Facebook and used internally by the company for forecasting.
The Prophet algorithm is of great use in capacity planning, such as allocating resources and setting sales goals. Owing to the inconsistent level of performance of fully automated forecasting algorithms, and their inflexibility, successfully automating this process has been difficult. On the other hand, manual forecasting requires hours of labour by highly experienced analysts.
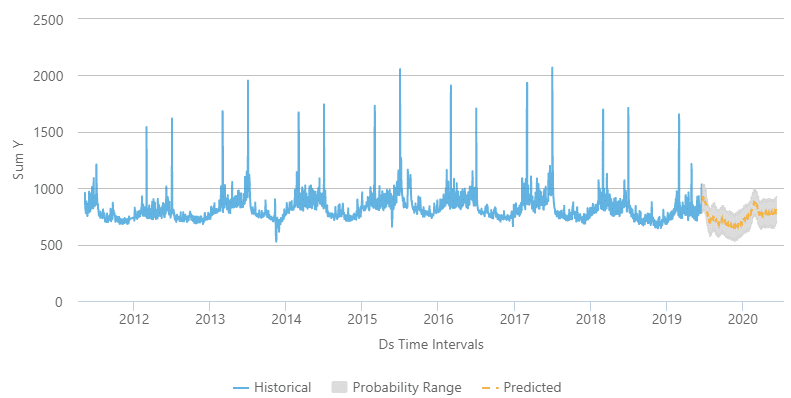
Prophet isn’t just automatic; it’s also flexible enough to incorporate heuristics and useful assumptions. The algorithm’s speed, reliability and robustness when dealing with messy data have made it a popular alternative algorithm choice for the time series and forecasting analytics models. Both expert analysts and those less experienced with forecasting find it valuable.
Summary
How do you determine which predictive analytics model is best for your needs? You need to start by identifying what predictive questions you are looking to answer, and more importantly, what you are looking to do with that information. Consider the strengths of each model, as well as how each of them can be optimised with different predictive analytics algorithms, to decide how to best use them for your organisation.

