When the Amazon founder, Jeff Bezos, was offered to sell advertising on the ecommerce marketplace store homepage, he answered “It is one of the stupidest ideas I’ve ever heard.” Nevertheless, he approved the idea, and currently, Amazon Advertising is worth almost $2.2 billion and is one of the virtual marketplace most-profitable services. It demonstrates the Amazon Culture of Metrics in action: Bezos approved this idea solely because it was proved by data.
Metrics or key performance indicators, help you to measure the success of an ecommerce business in achieving its goals.
There are multitudes of KPIs in ecommerce. To measure your success accurately, it’s best to form a set of metrics on the basis of your goals.
Ecommerce Metrics for Business growth and profitability
There are many KPIs to evaluate business development in ecommerce, and the following are fundamental for online shopping marketplaces.
Gross merchandise volume (GMV)
It’s an equivalent of the total order value and is measuring the dollar value of items sold in an Internet marketplace mall over a given period of time.
It is a fundamental KPI for ecommerce multi-seller marketplaces: it helps to measure business growth and the usage of a virtual shopping mall website by sellers.
Etsy GMS, the online marketplace equivalent of GMV (the domestic GMS is marked with orange, the international GMS is marked with pink):
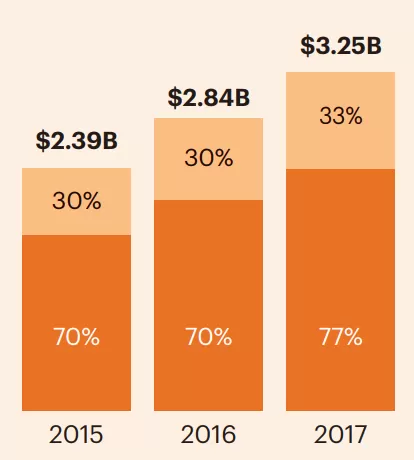
The indicator shows the ecommerce marketplace store growth, which is up to 14.5% in 2017 compared to 2016.
It is calculated prior to the deduction of any expenses, although shipping fees, net of refunds and returns should be excluded.
It is most useful as a comparative measure over time and is tracked on a monthly and yearly basis.
eBay Gross Merchandise Volume growth year over year:
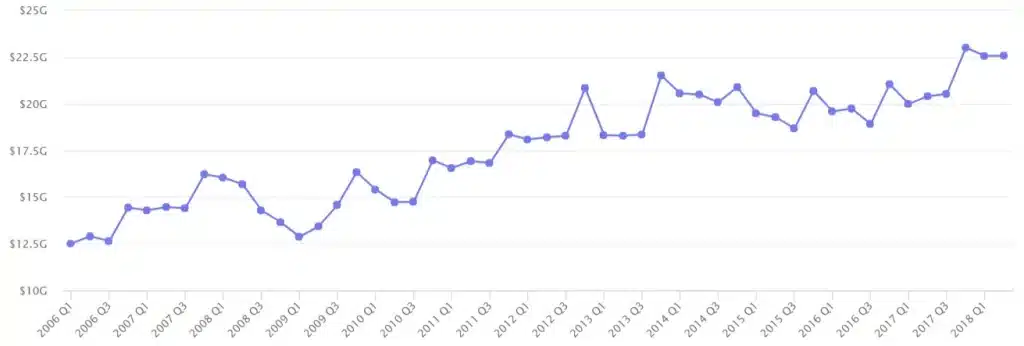
For service online shopping marketplaces, it’s important to take into account the difference between “contracted” and “delivered” GMV figures. In some service Internet shopping mall concepts, such as house-selling platform like Opendoor, there can be a delay between the two, which can cause incorrect GMV, if “contracted” figures are computed.
Average Order Value (AOV)
It reflects how much customers spend for every order they make, sales per each order, not per customer.
This metric helps to see your virtual marketplace store growth by reflecting the average transaction value, and profit increase.
Additionally, it gives insights into customers’ behaviour:
- whether or not clients are buying multiple items
- the items of what cost are the most popular on an ecommerce platform
- the volume and frequency at which buyers are willing to spend
It’s calculated monthly, weekly or daily, by dividing the total revenue by the number of transactions.
AOV = total revenue/number of transactions
By increasing AOV, you automatically increase the Return on Marketing Investment (ROMI).
Revenue
fcolorIt measures the income that the ecommerce multi-seller marketplace receives, in form of transaction fees, listing fees, and seller services.
It helps to track the efficiency of the virtual shopping mall website concept, and to break down the revenue flow to analyze its components.
Etsy’s annual revenue:
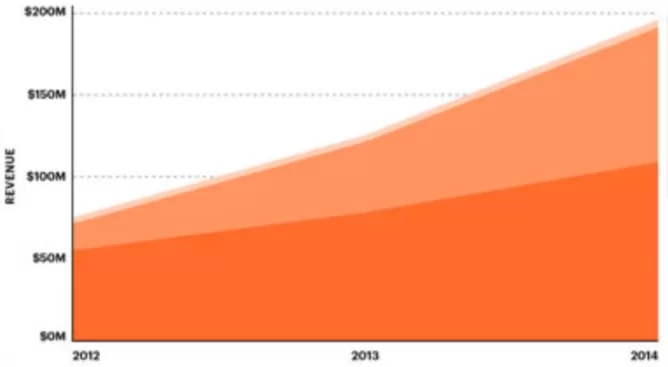
The online shopping marketplace revenue comprises two parts:
- an ecommerce marketplace store transaction fee and listing fee (marked with orange colour);
- seller services: direct checkout, promoted listings, shipping labels (marked with pink colour).
The metric helps the ecommerce multi-seller marketplace platform to track the efficiency of both parts of the revenue.
For the second part of the revenue—seller services, the virtual marketplace store has detailed metrics as well:
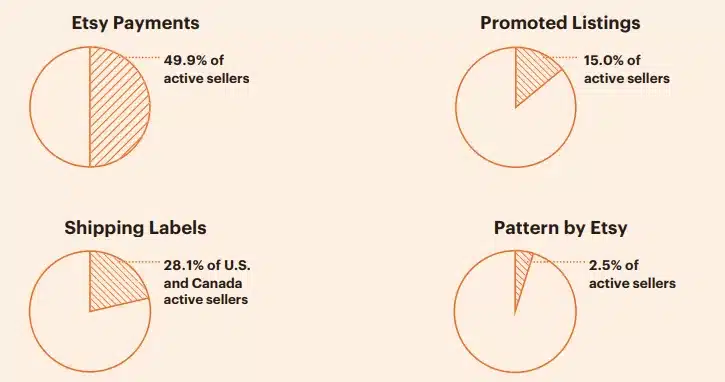
It helps to track and increase the efficiency of the Internet marketplace mall monetization model concept.
To gain a more granular view of seller services (value-added services), use an Average revenue per user metric.
Revenue also helps you to track the overall ecommerce multi seller marketplace growth year over year.
Etsy’s year-over-year revenue growth:
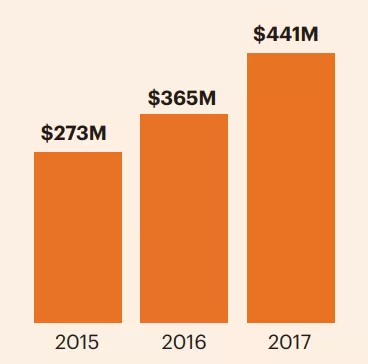
Revenue is calculated differently for various ecommerce marketplace stores, here is a guide on how to count it correctly.
Fulfilment rates
It reflects the percentage of the times when your online shopping marketplace delivers goods or services as promised.
It’s calculated through the following formula:
Fulfilment rate = The number of fulfiled orders / Total number of orders (including rejected, but excluding cancelled orders)
If fulfilment rates are getting negative, it’s necessary to use more narrow metrics to identify the reasons: if there are concrete items, services or suppliers with the most frequent fulfilment failures.
Supply-side development
Quantitative growth
These metrics do not reflect the performance that is directly connected with the ecommerce marketplace store’s main goals, like conversion and purchasing and are useful when you are actively embracing the new market category, or scaling your virtual shopping mall website concept.
- number of suppliers (it’s best to measure active sellers’ growth, with the monthly active users‘ metric), like Etsy:
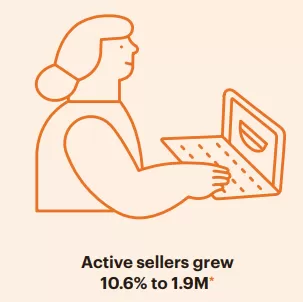
- suppliers’ growth rate;
- number of listings, and for a services web marketplace, count the number of active suppliers at a specific time instead;
- listings growth rate;
- users’ churn.
Qualitative growth
These KPIs help to see not only your Internet marketplace mall performance growth but also give insights on what is influencing that growth. They are also applicable to the demand side.
- users concentration: number of sellers vs. the percentage of the business they generate over a period; it is measured with whale curves metric.
It helps to track the most successful seller’s percentage and to define which seller types, goods or services are your virtual marketplace store growth drivers.
- cohort analysis: showcase the continued activity of a group of users acquired during a specific period, a week, month or a year ago.
Without metrics that are based on cohorts, you can only track which channel is driving the most traffic.
Etsy visits by channel:
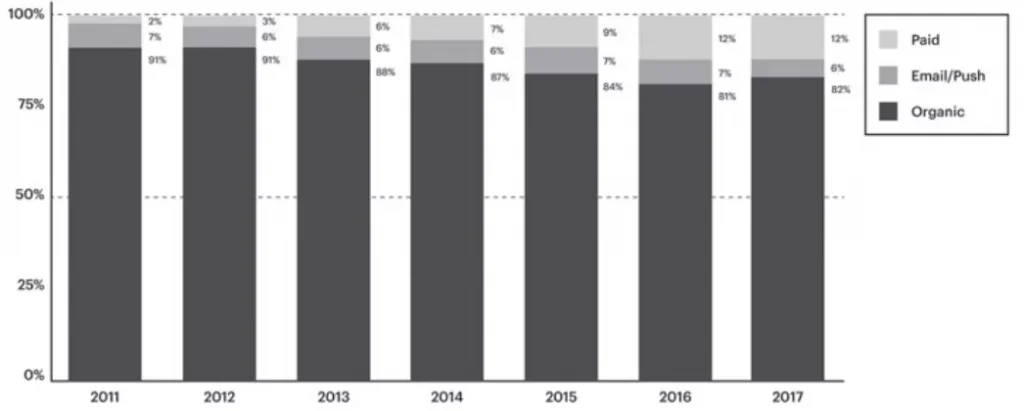
With such metrics, by analyzing the behaviour of cohorts —user groups who came through those channels a month or a year ago, you can also tell which channels are driving the most conversions.
Demand side development
Quantitative growth
- overall number of customers, and active buyers amount;
- buyer growth rate;
- churn rate.
Qualitative growth
- average dollar amount purchased per buyer;
- average number of orders per buyer;
- average order growth per buyer;
- customers’ satisfaction, measured regularly through the NPS (Net Promoter Score) metric and customer feedback;
- customer conversion percentage;
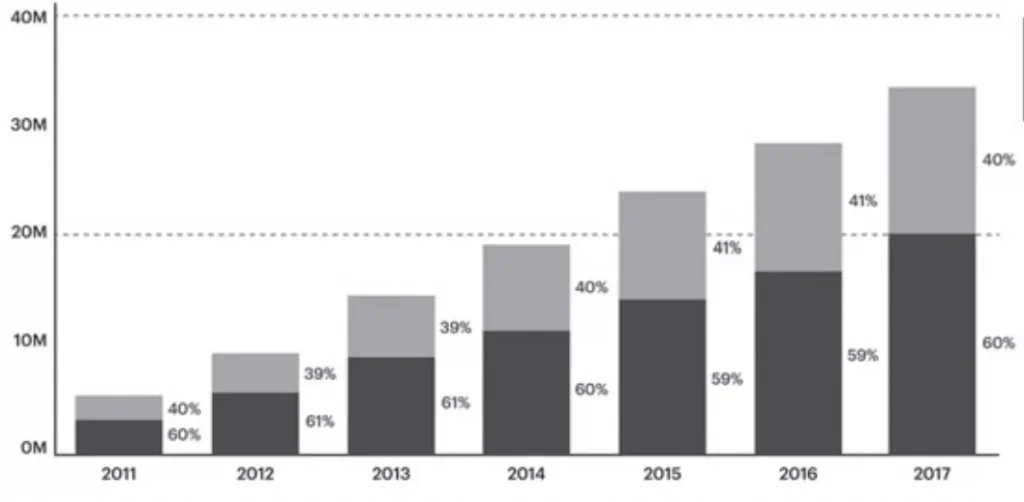
- repeat purchases.
Etsy’s repeat purchases metrics (the one-time purchases are matched with the dark colour, the multiple purchases are matched with the light colour):
Liquidity
Liquidity indicates how successful the ecommerce multi-seller marketplace platform is for sellers and buyers, and shows a marketplace ability to scale.
It’s calculated through the following formula:
Customer liquidity = visits on a given time period / transaction number
However, it may be counted differently depending on an ecommerce marketplace store type.
On Etsy, it is the proportion of total stock which is sold monthly. On Airbnb, it is the proportion of rooms which are booked each night. On Uber, it’s the percentage of drivers that are driving customers at any given hour.
Thus, there are basic metrics that help to track liquidity on any online shopping marketplace:
- how long it takes to make a transaction;
- the percentage of goods or services that are purchased hourly, daily, monthly;
- the percentage of listings that lead to transactions within a certain time period.
Client’s acquisition and retention
There are multitude metrics aimed to measure communication with clients. While some of them are soft KPIs that help you to track intermediate results like cost per click, the following are fundamental metrics, which show if you get a real value, purchases and repeat buyers, in return for your investments.
Return on Investment (ROI)
The metric shows what you gain out of your marketing investment—whether it’s profitable or not.
It’s calculated through the following formula:
ROI = (Profit – Investment) / Investment x 100
When using the metric, it’s necessary to take into account not only the instant profit but long-term benefits as well:
Your investments are: $5000 in organic traffic, and $500 in a paid ad.
Number of clients acquired: 30 through organic traffic and 10 through a paid ad.
Average checkout amount for both: $150
Therefore, ROI out of organic traffic:
(30 Х 150) — 5000) / 5000 Х 100 = — 10%
ROI out of a paid ad:
(10 Х 150) — 500) / 500 Х 100 = 200%
The metric shows that a paid ad result in a better profit.
However, ROI should always be calculated considering another metric—Customer Lifetime Value.
Customer Lifetime Value—total amount of sales that a client has generated over time.
The way Customer Lifetime Value is affecting ROI results is the difference in the quality of traffic that organic traffic and a paid ad brings.
Online customers that came through organic traffic are of much better quality and are more loyal, therefore, the probability is high in such a way that they are the ones who make repeat purchases.
Thus, Customer Lifetime Value metric can bring the following data to the equation:
Average Customer Lifetime Value for clients from organic traffic: $10,000.Average Customer Lifetime Value for clients from paid ads: $600.
In this case, you take into account the long-term profit as well, and ROI is the following:
ROI out of organic traffic:
(10.000 — 5000) / 5000 Х 100 = 100%
ROI out of a paid ad:
(1500 — 500) / 500 Х 100 = 200%
Calculating ROI in this way will lead to a clearer picture in terms of the long-term profit that you get.
Customer Acquisition Cost (CAC)
These metrics show how much you need to spend to get a paying customer.
It reflects not only soft results such as clicks or page views, but your revenue, since it measures your performance in making somebody a customer.
You may invest marketing budgets to get good pageview results but will gain one sale out of those results. It means, your cost per acquisition is the entire budget spent to date.
That’s why it’s necessary to use CAC metrics when measuring your marketing efforts.
It’s calculated by the following formula:
Cost Per Acquisition = Total costs associated with acquisition / Total new customers over the measured period
Those are fundamental metrics that help in measuring the main points of your Internet marketplace mall performance accurately.
However, many ecommerce multi seller marketplaces have different sets of KPIs. They were formed on the basis of online mall goals or concepts.
Etsy set of KPIs:
- Gross Merchandise Value (GMV);
- percent mobile Gross Merchandise Value;
- active sellers / active buyers;
- percent mobile visits;
- percent international GMV;
- the top retail categories.
The virtual shopping mall website is measuring the percentage of Gross Merchandise Value gained through mobile, since its intended audience is actively purchasing through mobile devices. Approximately, 51% of the virtual marketplace store GMV came from mobile purchases.


